Manan Patel
  • About Me
  • Projects
  • CV
  • Contact
Skip to main content

Projects

Selected work from my Master's program, each built around turning a large dataset into something a decision-maker can use.

Featured

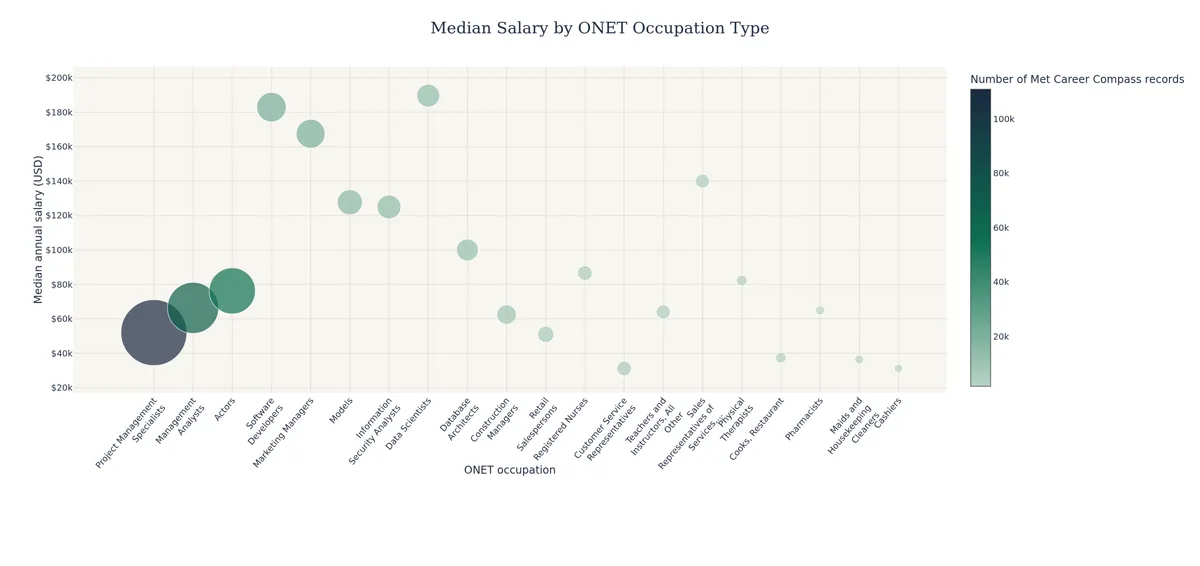
Bubble chart of median salary for the 20 occupations with the most job postings. Data Scientists and Software Developers sit highest, and the largest bubbles cluster in the lower middle of the range.

Course project · AD688 Module 3 · Fall 2026

Job-Market Salary Analysis at Scale

I used PySpark on AWS to clean and analyze about 504,000 job postings, then built interactive Plotly charts of salary by industry, occupation, education level, and remote-work type.

Postings without a stated salary were left out instead of being filled with an average, and each chart's write-up notes the data's quirks, such as hourly wages and default experience values. One finding: median posted pay for remote roles ($128,000) ran well above onsite roles ($77,500). The dataset was provided by the course.
  • PySpark
  • AWS EC2
  • Plotly
  • Quarto
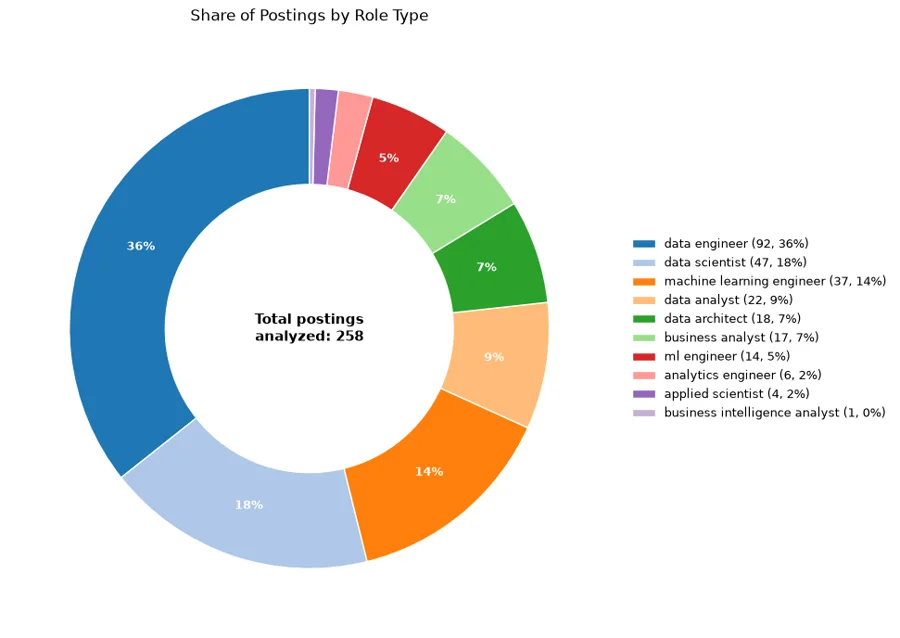
Donut chart showing the share of 258 analyzed job postings by role type, led by data engineer at 36 percent, data scientist at 18 percent, and machine learning engineer at 14 percent.

Team project · AD688 · Fall 2026

Career Evaluation Product, Group 6

A team-built career-evaluation product for job seekers targeting Data Analyst roles, with growth paths toward Data Scientist and Analytics Engineer, scoped to the Data Processing, Hosting, and Related Services industry (NAICS 5182).

The project site walks through data preparation, exploratory analysis, and a skill-gap analysis that asks which skills and tools best separate analyst roles from data-science and ML-oriented roles.

  • Quarto
  • GitHub Pages
  • Labor-market analytics
  • Team project

Live site Source

More charts from the salary analysis

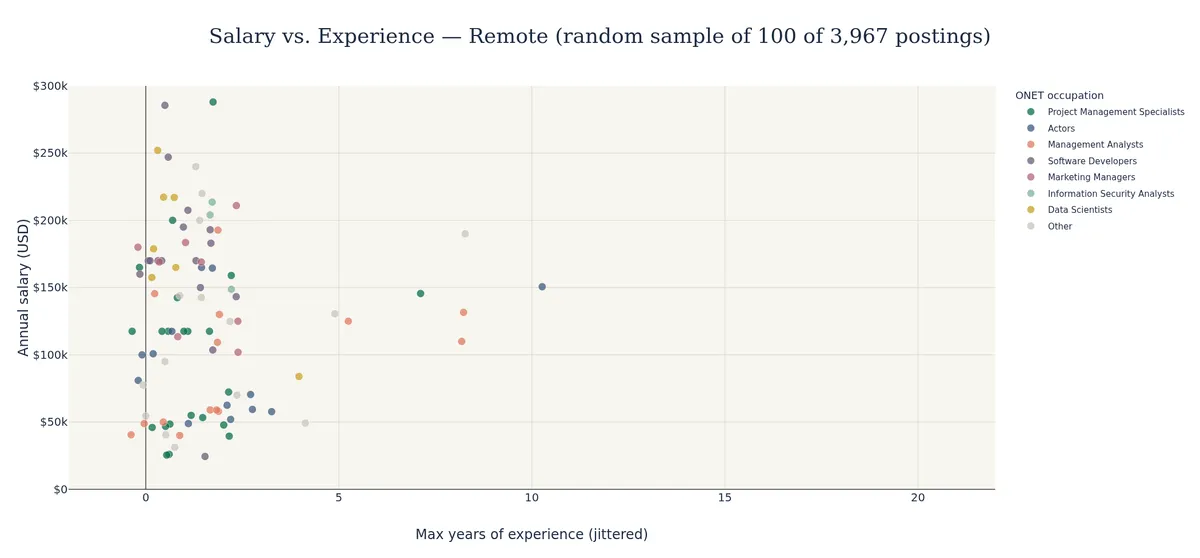
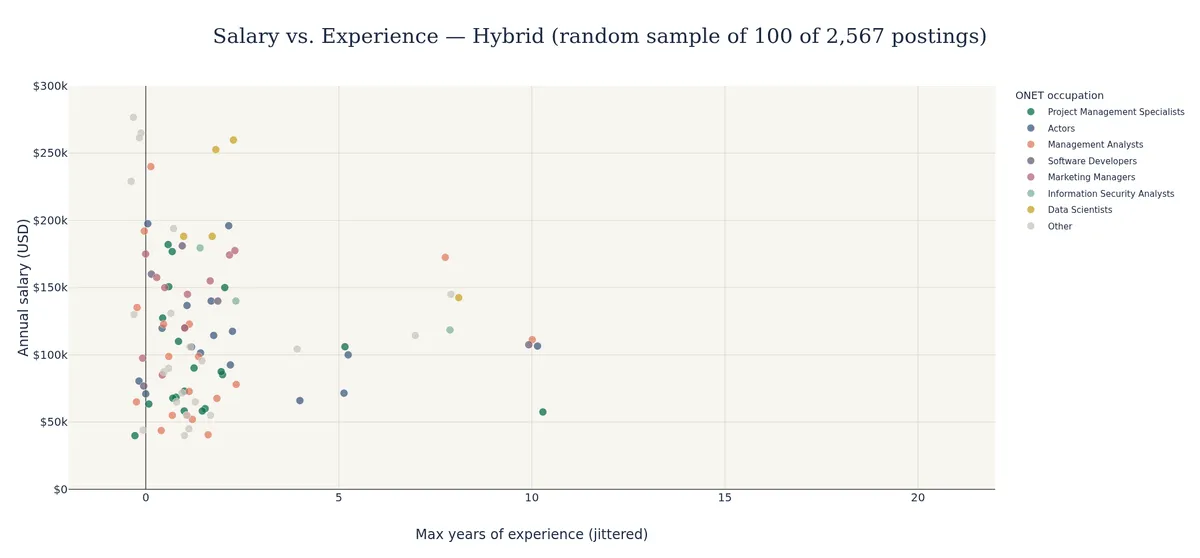
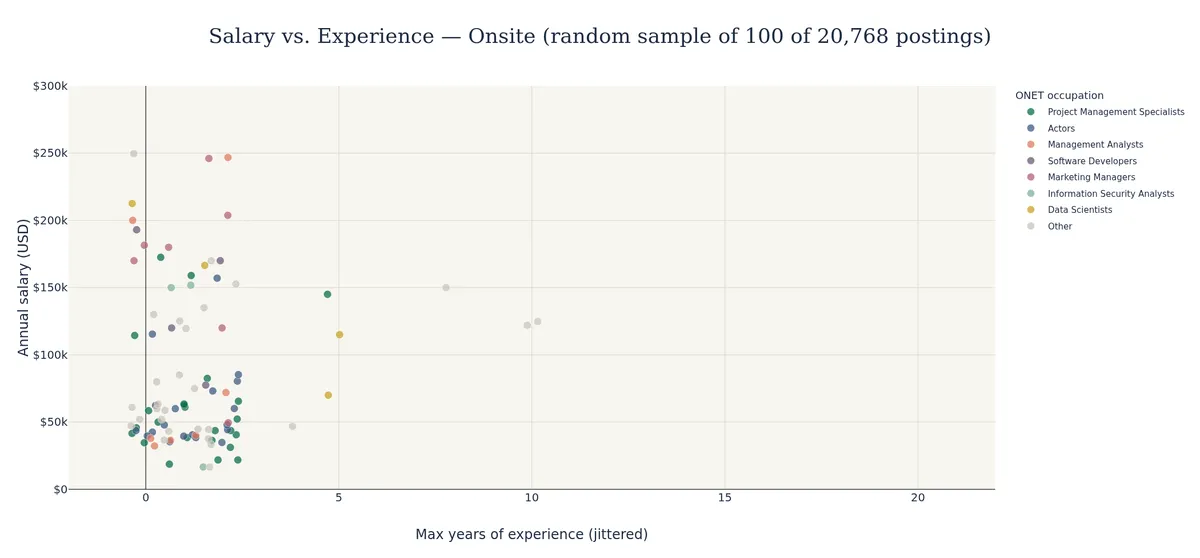
The full analysis has 12 charts. The occupation chart is featured above, and the rest are grouped below. Select any chart to open it at full size. Medians use only postings that list a salary, and the scatter plots show a random sample of 100 postings per group.

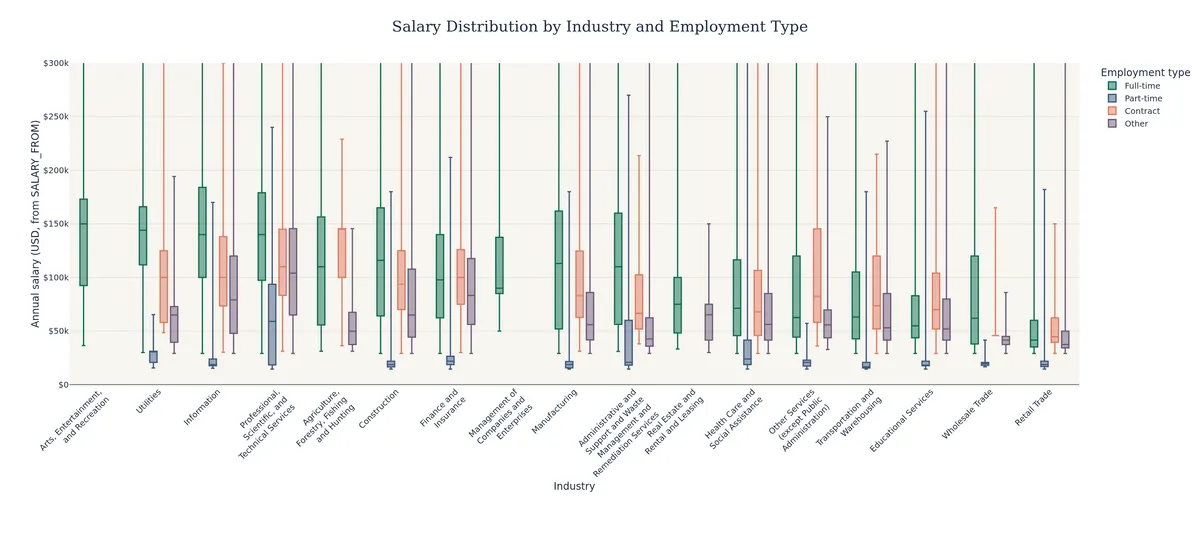
Pay by industry

Box plots of annual salary by industry, split by employment type: full-time, part-time, contract and other. Full-time pay is highest in industries on the left, such as Arts, Entertainment and Recreation, and lowest for Retail Trade on the right. Part-time pay sits far below the others in every industry shown.
Salary by industry and employment type: full-time median pay is highest in Arts, Entertainment, and Recreation ($150,000, based on only 43 postings) and lowest in Retail Trade ($41,600). Part-time figures annualize hourly wages at an assumed 20 hours a week.

Pay by education level

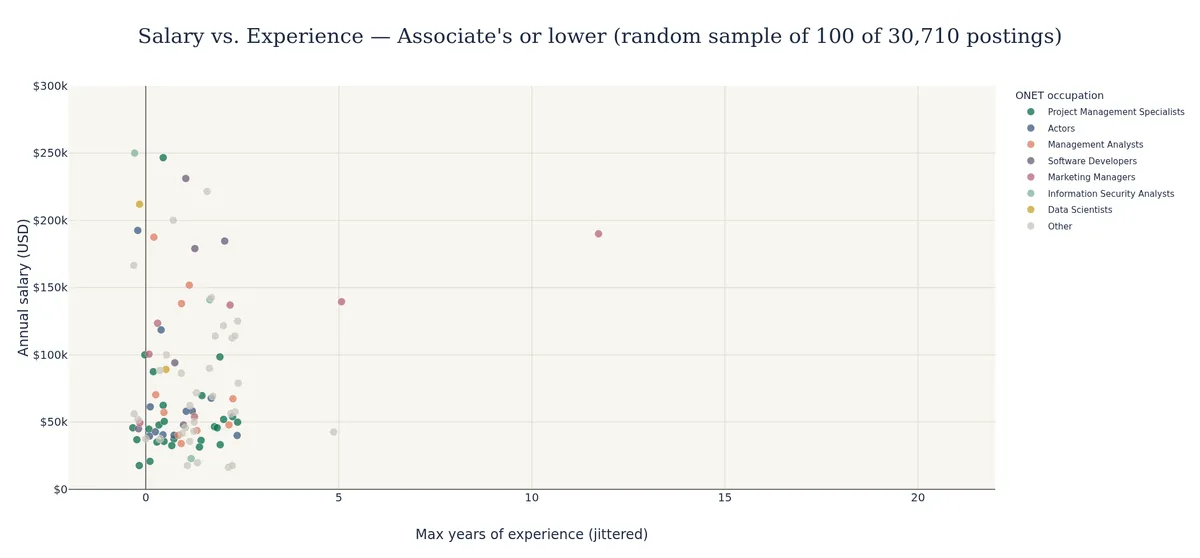
Scatter plot of annual salary against maximum years of experience for a random sample of 100 Associate's or lower postings, with points colored by occupation.
Associate's or lower: 30,710 postings with a usable salary, median $55,349. 95% show exactly one year of maximum experience, which looks like a platform default.
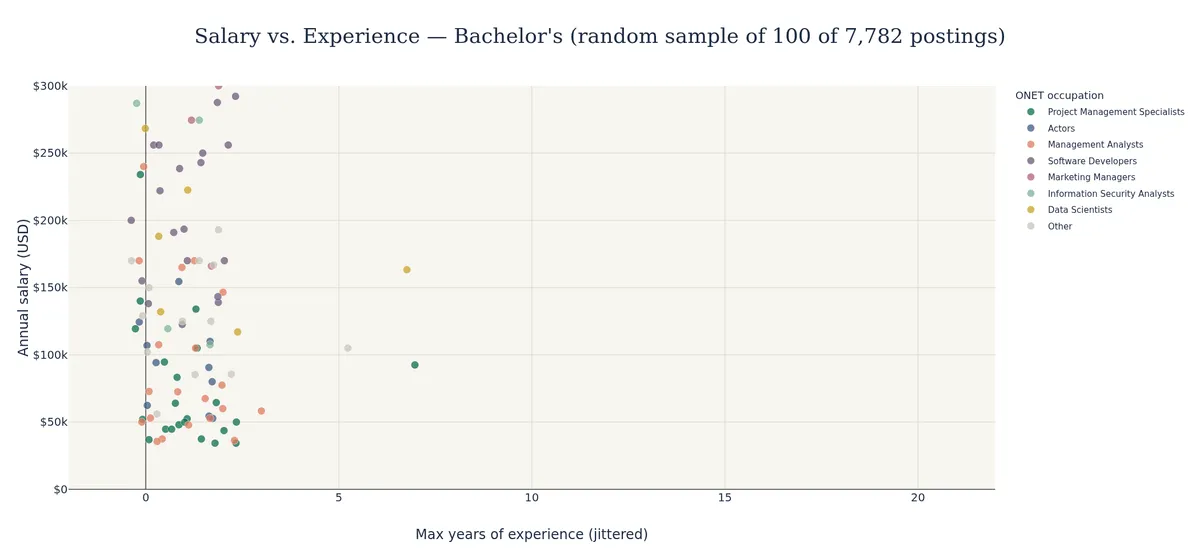
Scatter plot of annual salary against maximum years of experience for a random sample of 100 Bachelor's postings, with points colored by occupation.
Bachelor's: 7,782 postings with a usable salary, median $130,500. 91% show exactly one year of maximum experience, which looks like a platform default.
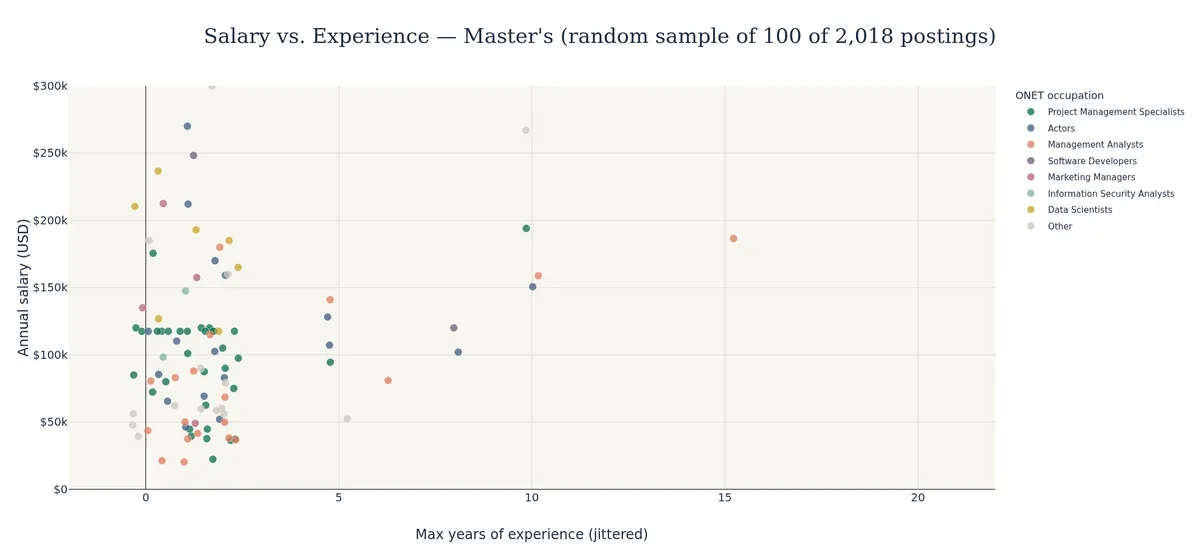
Scatter plot of annual salary against maximum years of experience for a random sample of 100 Master's postings, with points colored by occupation.
Master's: 2,018 postings with a usable salary, median $104,000. 83% show exactly one year of maximum experience, which looks like a platform default.
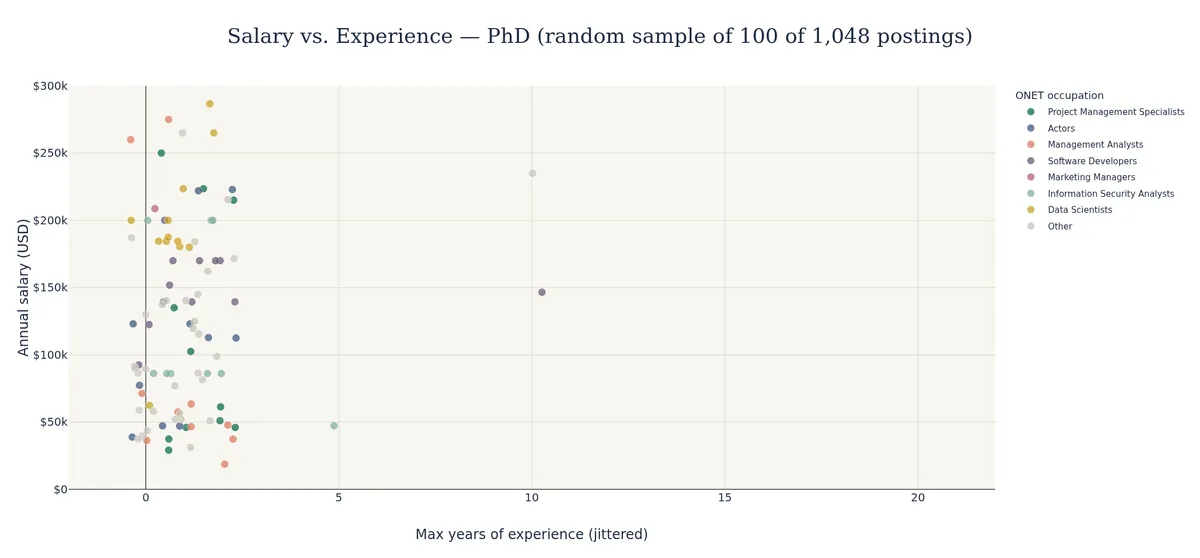
Scatter plot of annual salary against maximum years of experience for a random sample of 100 PhD postings, with points colored by occupation.
PhD: 1,048 postings with a usable salary, median $123,048. 95% show exactly one year of maximum experience, which looks like a platform default.

Pay by work type

Scatter plot of annual salary against maximum years of experience for a random sample of 100 Remote postings, with points colored by occupation.
Remote: 3,967 postings with a usable salary, median $118,080. 87% show exactly one year of maximum experience, which looks like a platform default.
Scatter plot of annual salary against maximum years of experience for a random sample of 100 Hybrid postings, with points colored by occupation.
Hybrid: 2,567 postings with a usable salary, median $115,000. 78% show exactly one year of maximum experience, which looks like a platform default.
Scatter plot of annual salary against maximum years of experience for a random sample of 100 Onsite postings, with points colored by occupation.
Onsite: 20,768 postings with a usable salary, median $57,300. 95% show exactly one year of maximum experience, which looks like a platform default.

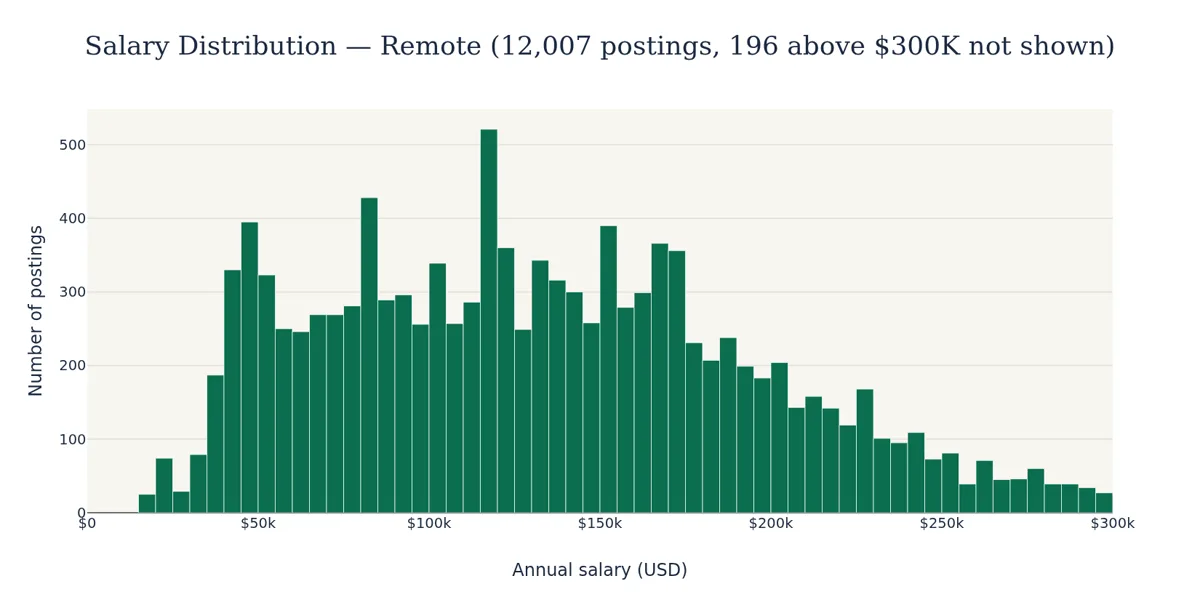
Salary distributions: remote, hybrid and onsite

Histogram of annual salary for remote job postings, broad and fairly even from about 40 thousand to 200 thousand dollars.
Remote: 12,007 postings with a usable salary, median $128,000. Only 9.3% pay under $50,000.
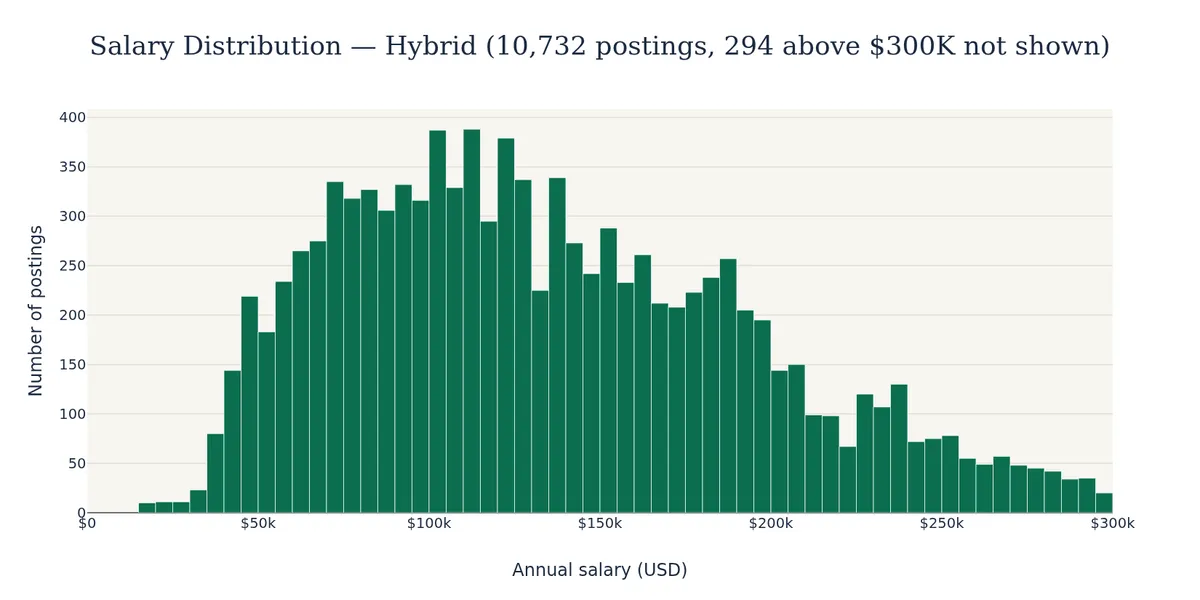
Histogram of annual salary for hybrid job postings, rising to a broad peak between about 100 and 130 thousand dollars and tapering off toward 300 thousand.
Hybrid: 10,732 postings with a usable salary, median $127,300. Only 4.6% pay under $50,000, the lowest share of the three groups.
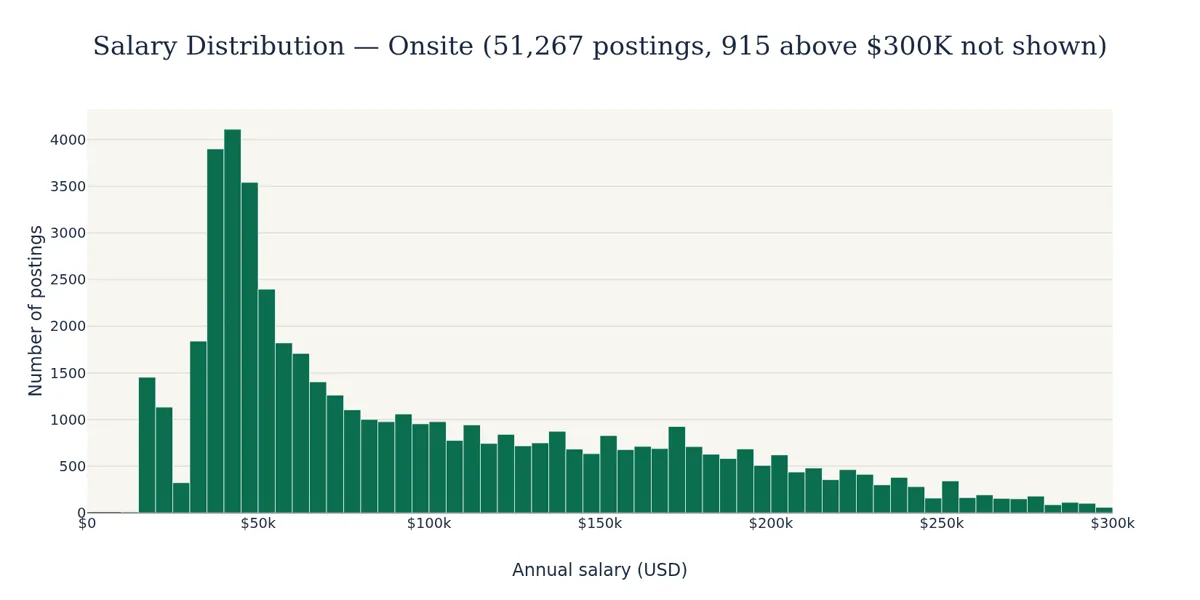
Histogram of annual salary for onsite job postings, with a sharp peak between 30 and 50 thousand dollars and a long tail to the right.
Onsite: 51,267 postings with a usable salary, median $77,500. Nearly a third (31.8%) pay under $50,000.

More coursework and builds

Module 2 · Fall 2026

Spark SQL and DataFrames analysis

Spark SQL queries over a multi-table job-postings schema: salary by industry and metro area, top remote-hiring companies in California, and monthly posting trends. Null-safe joins kept rows from being silently dropped.

  • Spark SQL
  • PySpark
  • Plotly
  • Seaborn

Module 1 · Fall 2026

Cloud foundations on AWS

Set up a cloud development environment on AWS EC2 with Spark, VS Code Remote-SSH, and Git, then used it to build and publish the first version of this site.

  • AWS EC2
  • Spark
  • Git

Personal project

This portfolio site

Built with Quarto and deployed to GitHub Pages through GitHub Actions. Designed to load quickly, with optimized images, system fonts, no tracking scripts, a light and dark mode toggle, and accessible markup.

  • Quarto
  • GitHub Actions
  • CSS

Source

© 2026 Manan Patel · Built with Quarto